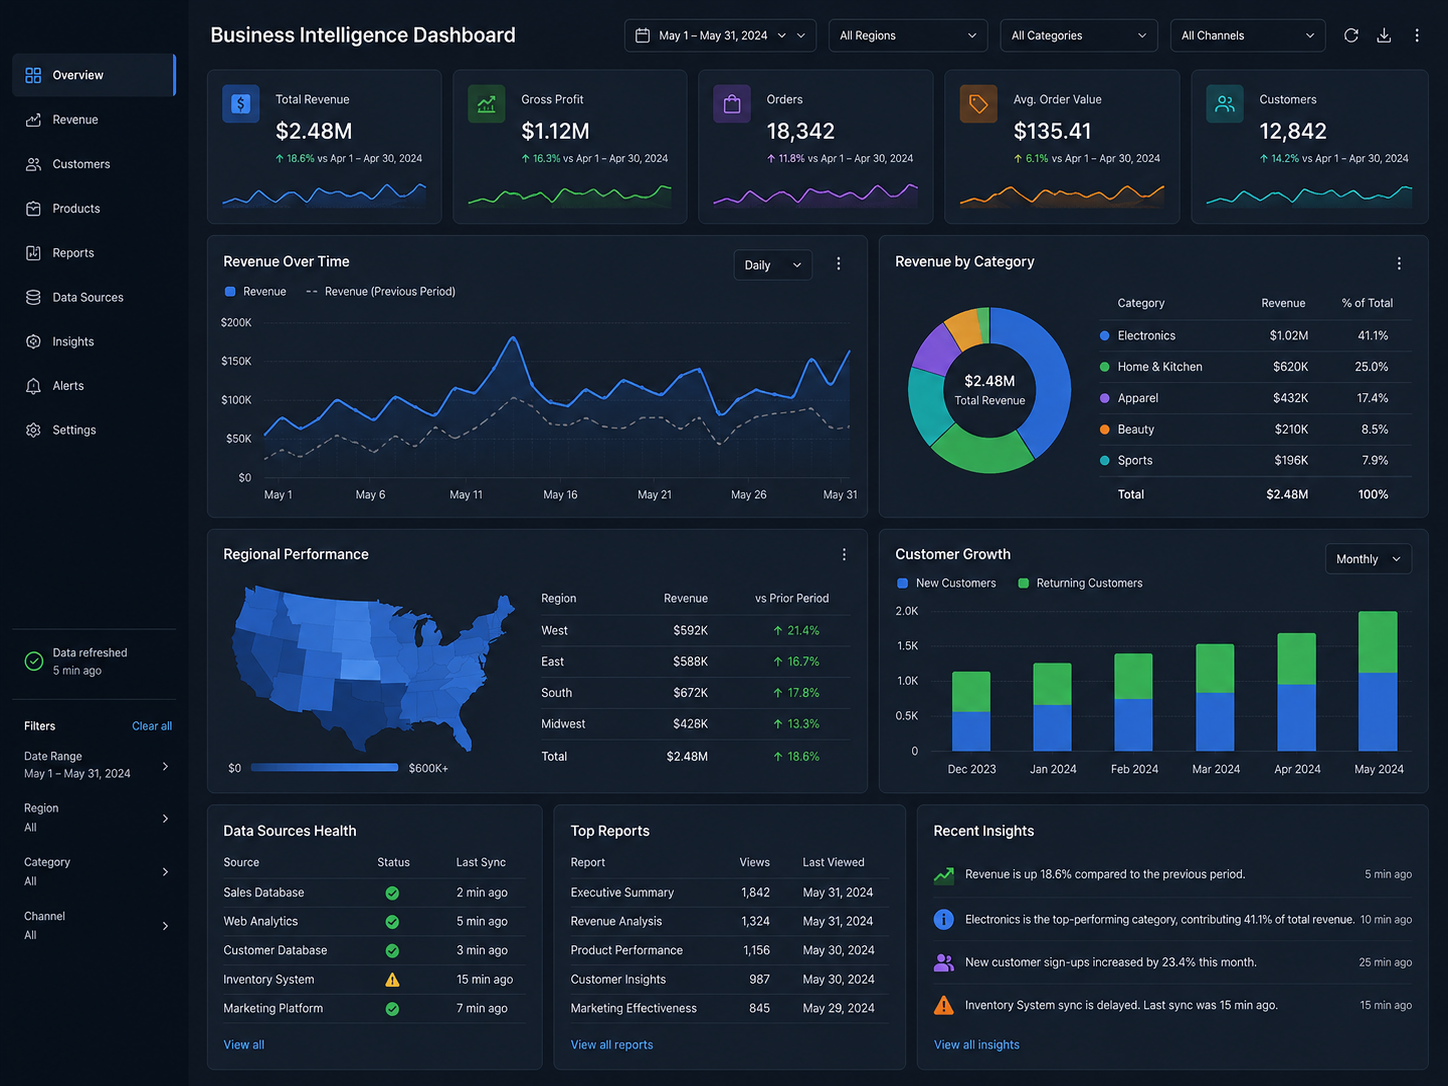
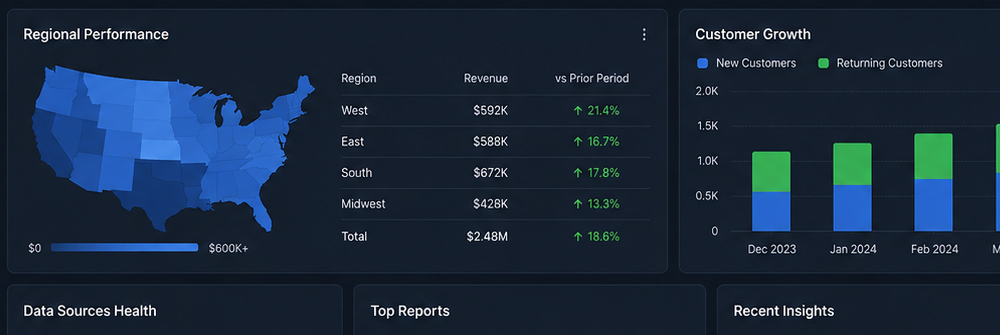
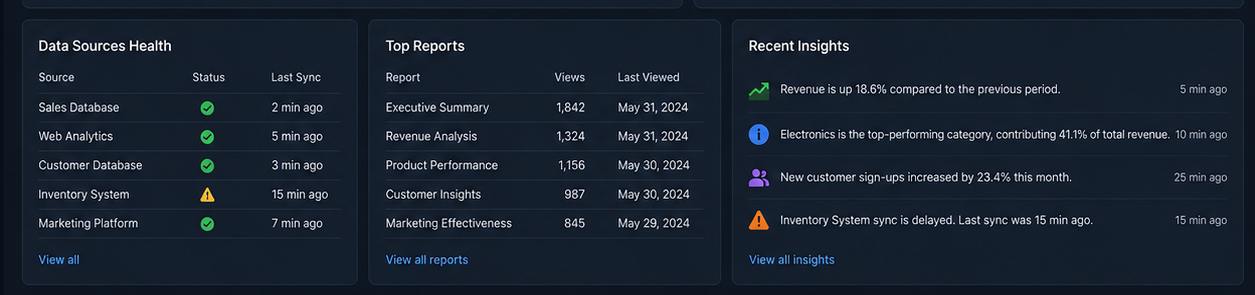
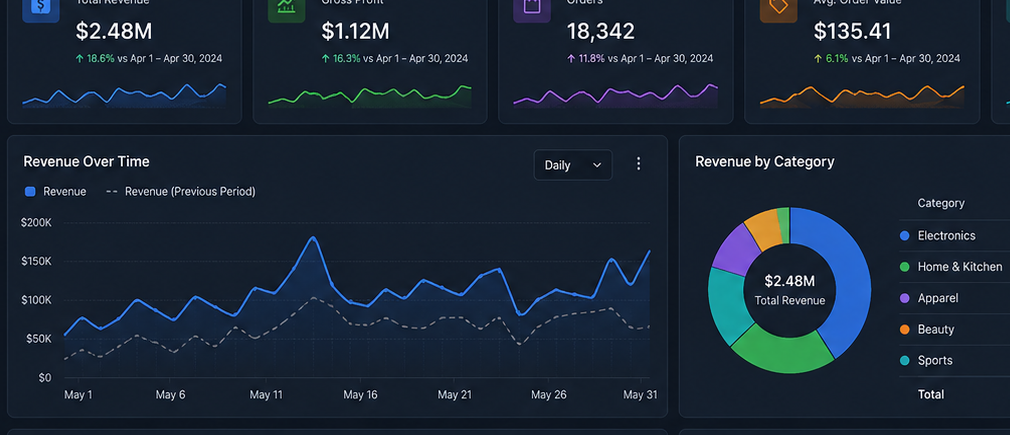
A professional analytics dashboard built to transform business data into readable and actionable insight. It combines KPI cards, revenue analytics, category performance, regional insights, reporting, and data-source health into one premium workspace.
This project turns raw data into decision-ready dashboards with premium presentation and clear reporting structure.
The BI dashboard was designed for executive-style reporting and daily insight discovery. It moves from top-level KPIs to deeper analysis across categories, regions, reports, and data health while keeping the experience professional and easy to scan.
Top-level KPI cards for revenue, profit, orders, and customer activity.
Revenue by category for comparison, trend spotting, and planning.
Geographic performance blocks that help compare business regions.
Recent insights and data alerts surfaced in a clean support layer.
These tabs simulate opened sections of the same project. Each tab represents another screen or working area of the system and is shown with a separate realistic screenshot and explanation.
The main BI screen with KPI cards, revenue trend, and category performance.
A supporting tab for regional performance and customer growth analytics.
A deeper reporting tab that highlights source health and recent insights.
A closer look at top-level data trends and analytics structure.
Highlights reporting lists, system sync health, and recent intelligence.
The challenge was presenting large amounts of business data without making the interface feel heavy or confusing. The final dashboard kept summaries simple while still exposing rich charts, reports, and operational insights.
The final design delivers a cleaner and more professional case-study presentation for this project while also showing multiple realistic product views in a client-friendly format.
Return to the project view page to explore the rest of the portfolio collection and open the other project detail pages.