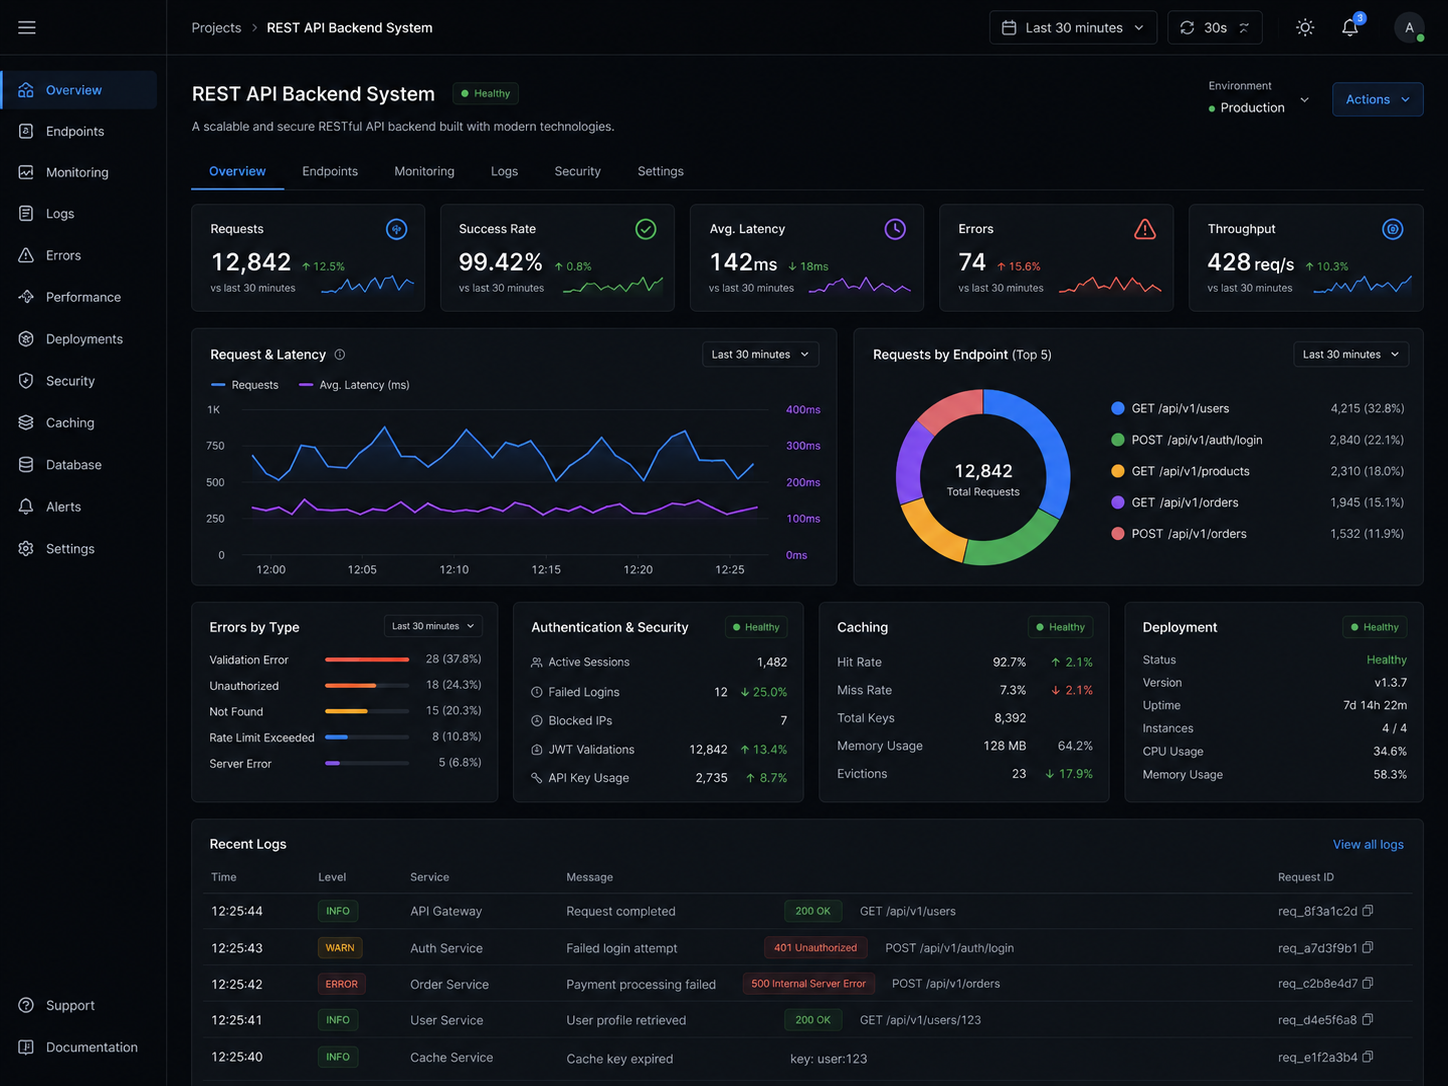
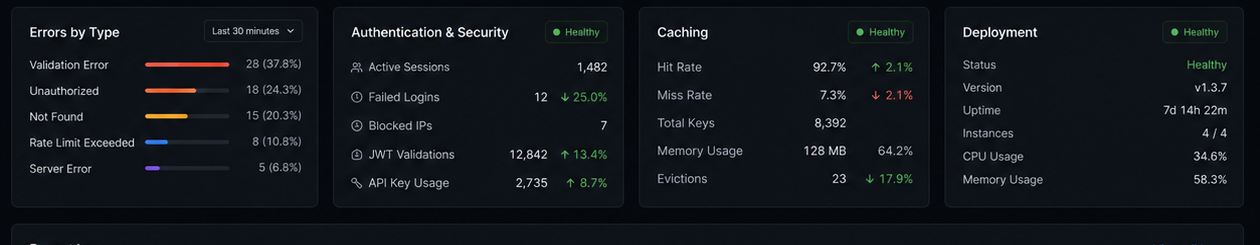
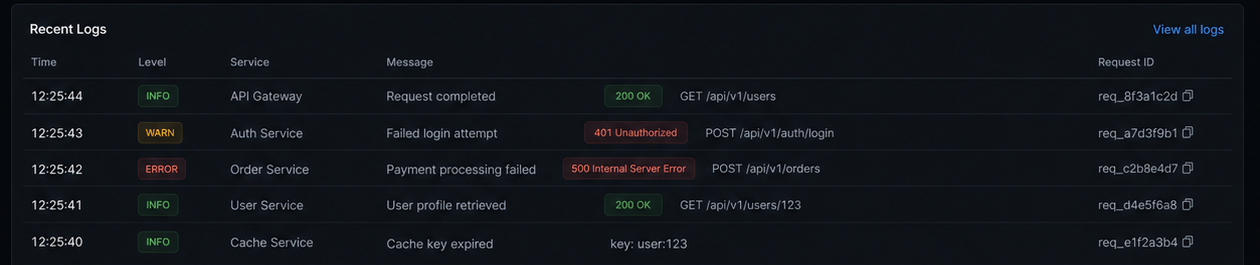
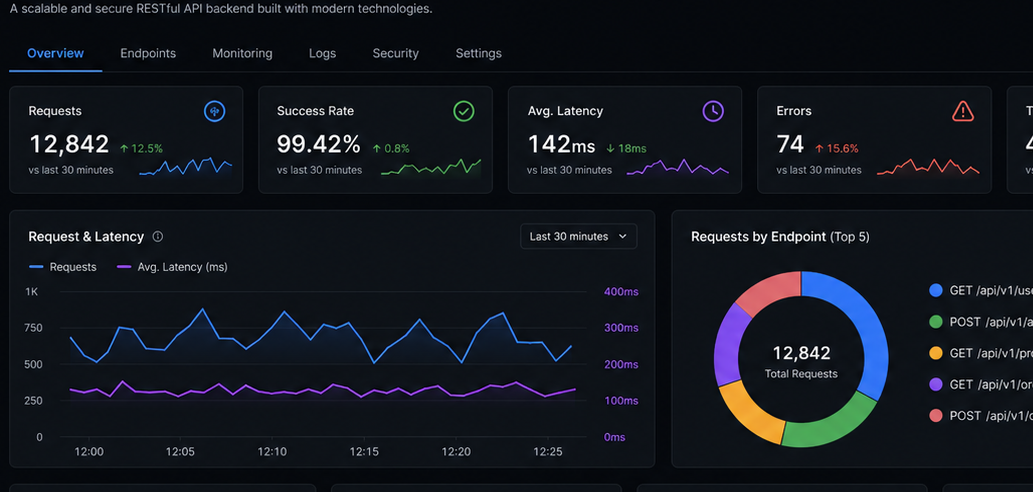
A dark-mode backend monitoring interface built for a modern REST API environment. The project focuses on observability, endpoint activity, request performance, security metrics, caching, deployments, and live operational logs.
This backend dashboard provides fast visibility into performance, stability, security, and logging workflows.
The API project centered around visibility into backend behavior. It helps developers and operators track endpoint activity, request latency, error patterns, authentication metrics, caching performance, and recent logs from one operational screen.
Live request counts and latency tracking for fast performance review.
Traffic distribution by endpoint to identify important routes.
Authentication and API usage blocks that support safe operations.
Recent log streams for debugging, issue review, and system tracing.
These tabs simulate opened sections of the same project. Each tab represents another screen or working area of the system and is shown with a separate realistic screenshot and explanation.
The main backend screen with requests, success rate, latency, errors, and throughput.
A supporting tab for errors, authentication, caching, and deployment state.
A detailed tab focused on backend logs, messages, and request IDs.
Shows monitoring charts and distribution by endpoint.
A supporting operations view focused on backend tracing and logs.
The backend needed a cleaner operational layer so the team could monitor traffic, latency, failures, and health without jumping across tools. The final solution improved observability and made monitoring far more efficient.
The final design delivers a cleaner and more professional case-study presentation for this project while also showing multiple realistic product views in a client-friendly format.
Return to the project view page to explore the rest of the portfolio collection and open the other project detail pages.